Mariners' Hitting
Only 54 games remain in the regular season. How are the Mariners' batters looking?
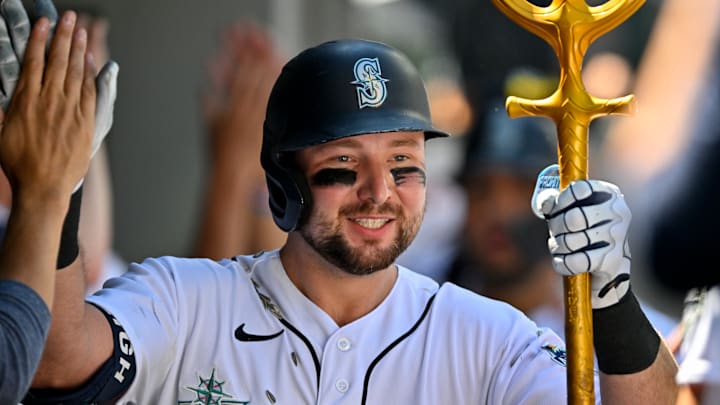
Players in the Mariners’ lineup have improved their batting averages across the board. Cade Marlowe leads the way with a BA of .308. Tom Murphy has an average of .300. J.P. Crawford follows at .261, and Ty France and Julio Rodriguez tie at fourth place with .253 and .251, respectively.
Rodriguez has been at bat 439 times, more than any other player, and has more hits than everyone else too: 110. France is not too far behind at 102. Crawford has walked 57 times, the current team record. France has hit 26 doubles; Hernandez has hit two triples, and Raleigh and Rodriguez have hit 17 home runs each, followed closely by Teoscar Hernandez with 16 and Suarez with 15.
The Mariners have a collective batting average of .235 and are twenty-second out of thirty in hitting. Previously, the Mariners ranked as low as twenty-six!
How about the Pitching?
The Mariners’ pitching staff, starters and relievers, have a cumulative ERA of 3.81 and are fourth in MLB. Luis Castillo leads the others in various categories. Easton McGee and Robbie Ray are out for some time. Marco Gonzales is hopefully back sooner.
The Starting Five
Pitcher | Innings Pitched | ERA | Runs Allowed | Strikeouts |
|---|---|---|---|---|
L. Castillo | 131.1 | 2.88 (down from 3.02) | 50 | 149 |
L. Gilbert | 130.2 | 3.86 | 59 | 126 |
G. Kirby | 128.2 | 3.86 | 51 | 119 |
B. Miller | 80.2 | 4.35 | 39 | 75 |
B. Woo | 49 | 4.96 | 30 | 54 |
Los Bomberos, the Firemen
Several relievers such as Paul Sewald, Chris Flexen, and Trevor Gott are no longer with us. The rest of the group look good. Penn Murfee is out with an injury.
Pitcher | Innings Pitched | ERA | Runs Allowed | Strikeouts |
|---|---|---|---|---|
T. Saucedo | 31.2 | 2.27 | 5 | 32 |
J. Topa | 42 | 2.57 | 15 | 38 |
A. Munoz | 25.2 | 2.81 | 8 | 36 |
I. Campbell | 7 | 2.57 | 2 | 9 |
M. Brash | 45.2 | 3.35 | 19 | 78 |
G. Speier | 36.2 | 3.68 | 15 | 38 |
T. Thornton | 7.2 | 1.17 | 0 | 3 |
The Mariners in Relationship to the American League Teams
The last column has the Mariner Win-Loss Record and/or the Next Date the Mariners Play the Team.
Teams | Wins | Losses | Win % | Division | M's and team |
|---|---|---|---|---|---|
Orioles | 66 | 41 | .617 | East | WLL, 8/11 |
Tampa Bay | 66 | 44 | .600 | East | LWW, 9/7 |
Houston | 62 | 47 | .569 | West | LWW/WLW, 8/18, 9/25 |
Texas | 61 | 46 | .570 | West | LWL/LLL, 9/22, 9/28 |
Toronto | 59 | 49 | .546 | East | LLW / WWL |
Boston | 57 | 51 | .528 | East | WLL / WLW |
Seattle | 56 | 52 | .519 | West | |
Angels | 56 | 53 | .514 | West | LWL/LWL, 8/3, 9/11 |
Yankees | 55 | 52 | .514 | East | LWL, LLW |
Twins | 55 | 53 | .509 | Central | WLLW / WLL |
Cleveland | 53 | 56 | .486 | Central | WLL / WWLL |
Detroit | 48 | 60 | .444 | Central | WWL / LLW |
White Sox | 43 | 65 | .398 | Central | WLW, 8/21 |
Kansas City | 33 | 75 | .306 | Central | 8/14, 8/25 |
Oakland | 30 | 78 | .278 | West | WWW / WWWW, 8/28, 9/18 |
Will the Mariners be a Wild Card team? There is still the possibility. I would like to hold out hope for a great finish to the season!
