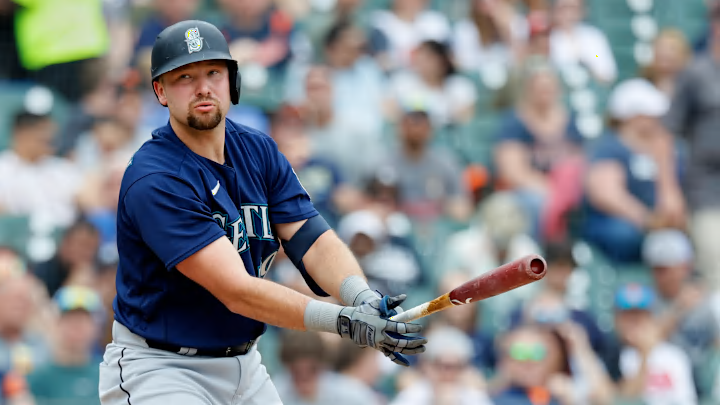
The Mariners have played 43 games. They are one-quarter of the way through the season of 162 games. This check-in looks first at the Mariners' batting statistics, then their pitching numbers, and finally at the American League as a whole to see where the Mariners fit.
How the Mariners Look at the Plate
The Mariners' batting is heating up. Last year and into this year, hitting has been the Mariners' weakest area compared to pitching and fielding. Just take some of the numbers and multiply them by four in order to compare what end-of-the-sesason totals might be and how they looked compared to 2022. Note the performance by Cal Raleigh at Fenway Park.
Games | Hits | Walks | Double | Triple | HRs | RBIs | Batting Avg. | |
|---|---|---|---|---|---|---|---|---|
Caballero | 19 | 13 | 5 | 3 | 0 | 0 | 4 | .289 |
J.P. Crawford | 40 | 31 | 26 | 9 | 0 | 1 | 16 | .240 |
T. France | 42 | 44 | 13 | 13 | 1 | 2 | 20 | .275 |
Haggerty | 16 | 4 | 3 | 0 | 0 | 0 | 0 | .121 |
Teoscar H | 42 | 40 | 6 | 5 | 0 | 8 | 22 | .242 |
J. Kelenic | 40 | 41 | 10 | 11 | 1 | 8 | 21 | .283 |
T. Murphy | 15 | 11 | 2 | 5 | 0 | 1 | 2 | .234 |
AJ Pollock | 27 | 12 | 6 | 3 | 0 | 4 | 13 | .158 |
C. Raleigh | 36 | 29 | 16 | 6 | 1 | 7 | 22 | .230 |
J. Rodriguez | 40 | 36 | 14 | 7 | 1 | 7 | 20 | .217 |
E. Suarez | 42 | 36 | 22 | 5 | 0 | 4 | 21 | .229 |
T. Trammell | 11 | 4 | 5 | 0 | 0 | 3 | 9 | .160 |
K. Wong | 32 | 17 | 8 | 3 | 0 | 0 | 8 | .177 |
MLB HIghest | 45 (Several) | 405 (TB) | 196 (LAD) | 96 (BOS) | 11 (KC) | 81 (TB) | 257 (TB) | .275 (TB) |
SEA total | 42 | 324 | 141 | 72 | 4 | 45 | 180 | .229 |
The stats next to the players' names are individual statistics. The last two lines are all-team numbers.
